Dashboard Tour
See what the main Appodeal dashboard looks like
Screenshots may be outdated. Please refer to the live Appodeal dashboard for the most current UI.
Let's imagine you've integrated a few of your apps with Appodeal's SDK and monetized for about a month.
On your main dashboard tab, you will be greeted by three sections:
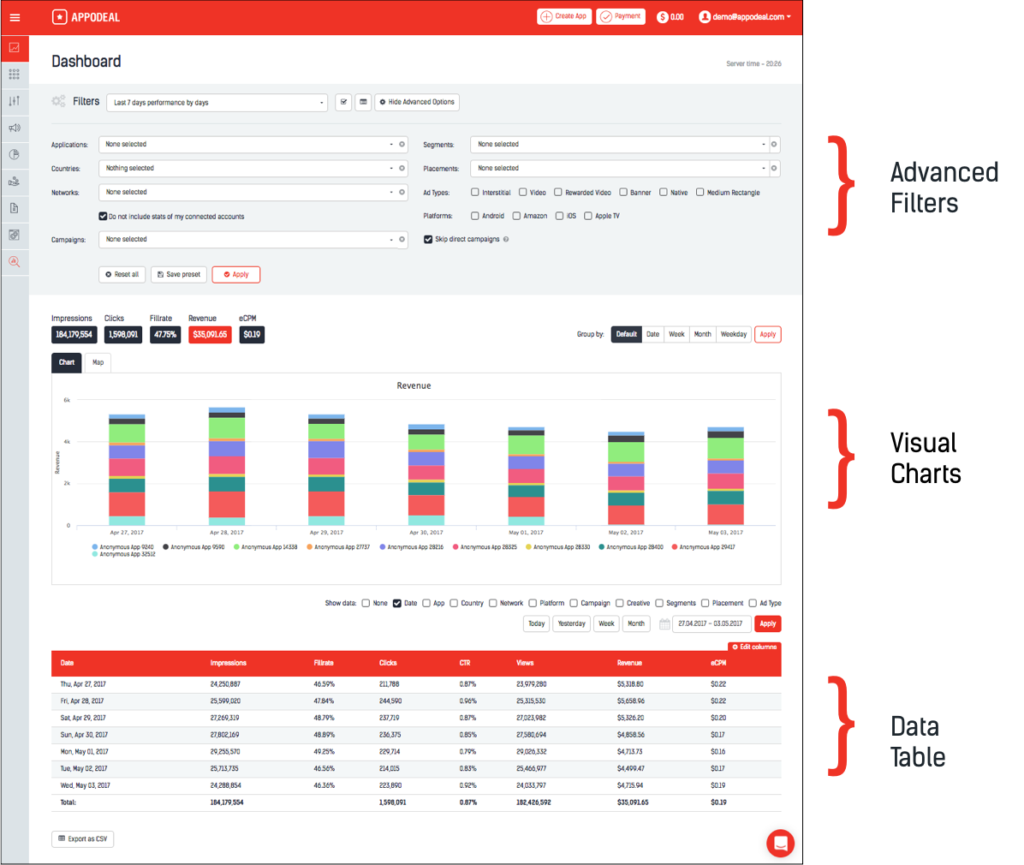
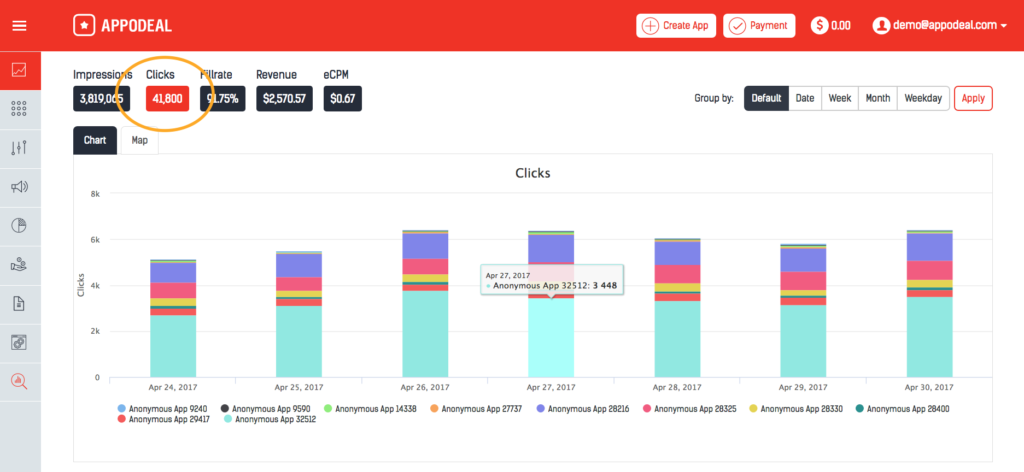
Visual Charts
This section provides you with a quick snapshot of your apps' revenue performances.
Revenue (Your Earnings)
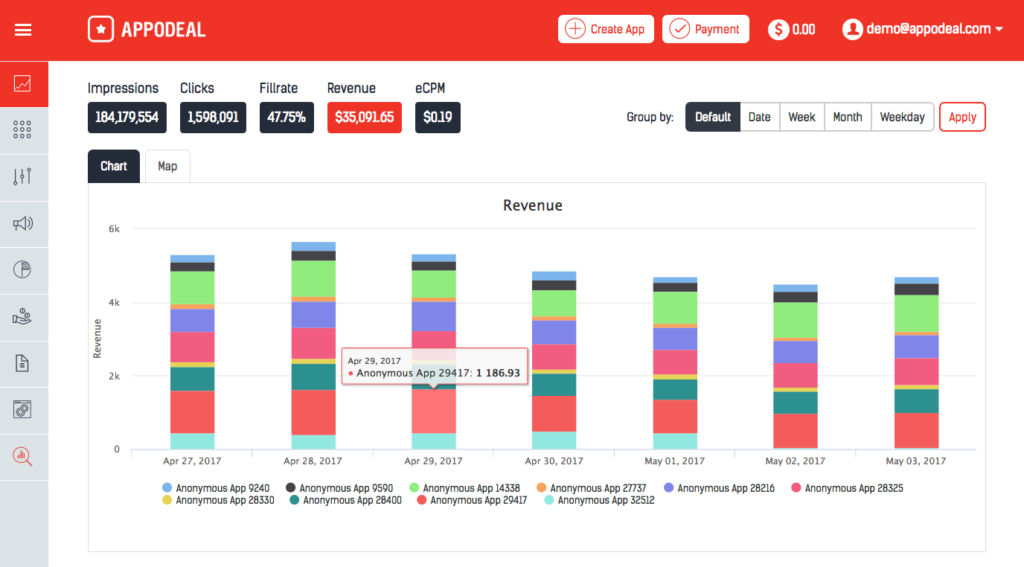
Here you can see how much each of your apps earned over the selected time period. You can set the chart breakdown by day, week, month and even day of the week.
Impressions (The number of each time an ad was served)
Clicks (The number of each time an ad was clicked on)
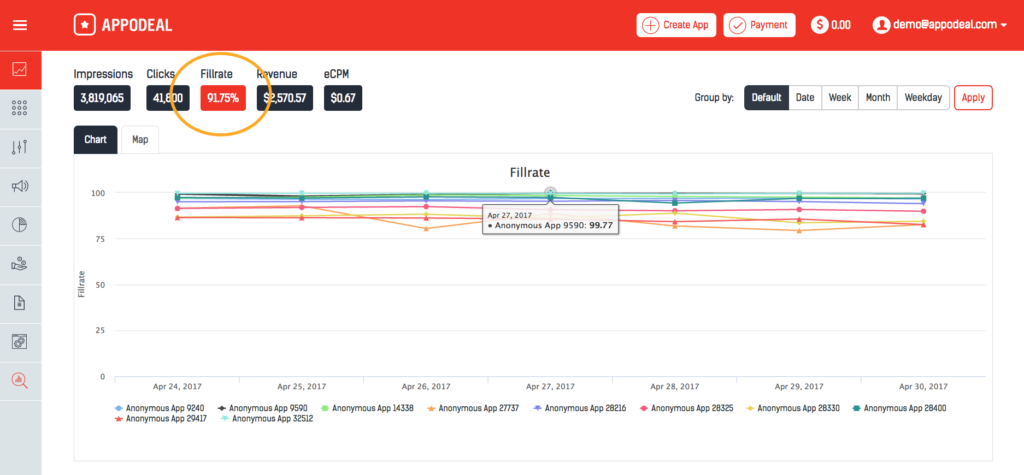
Fillrate (The percentage of ads served from ads requested)
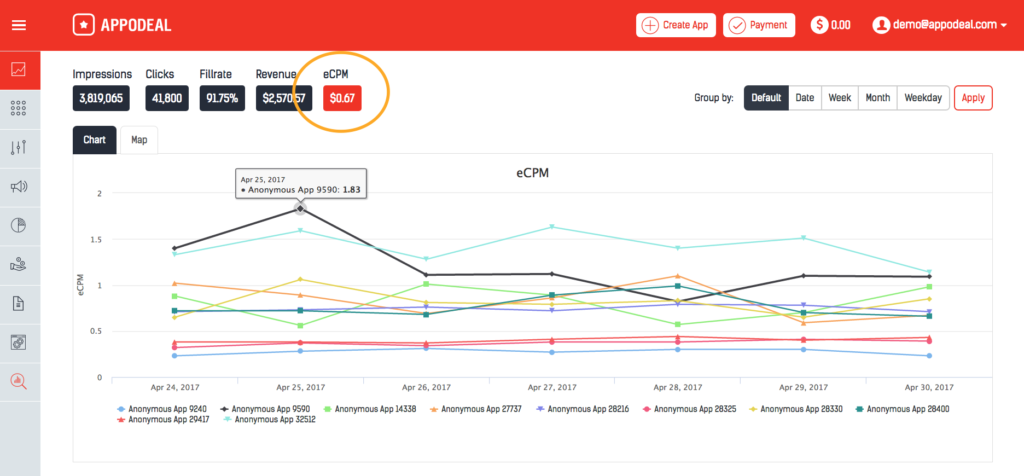
eCPM (The effective cost per mille is your earning for every 1,000 impressions)
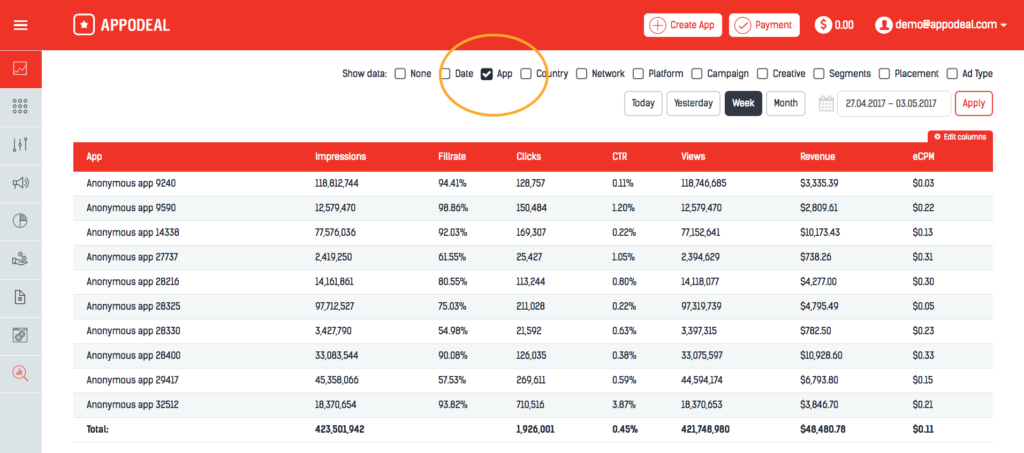
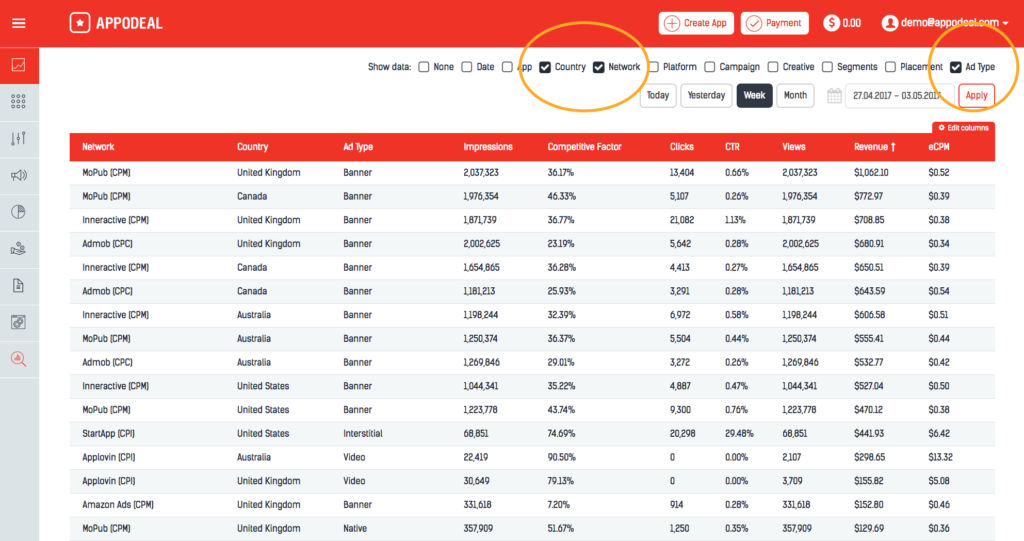
Data Table
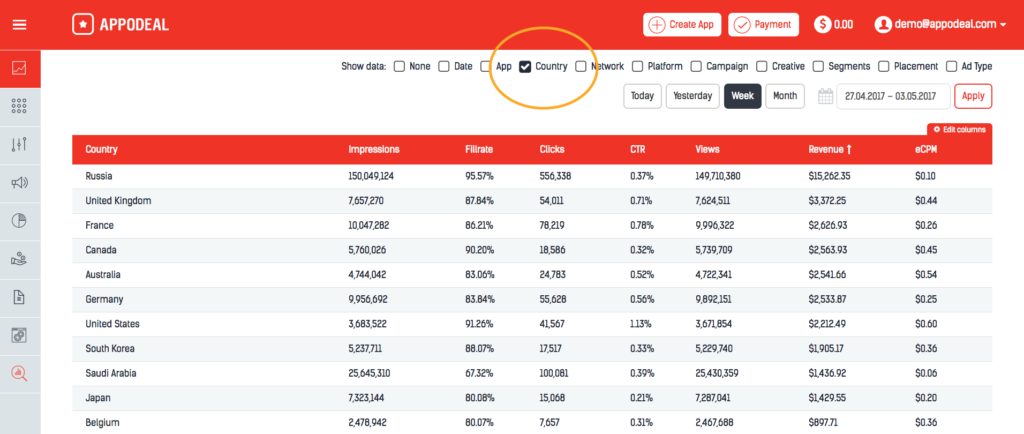
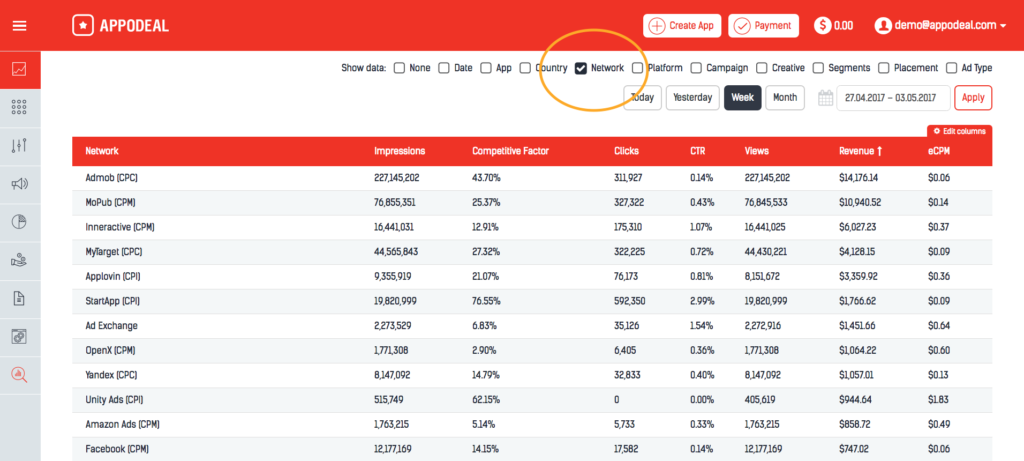
Down at the Data Table section is where you can get a more in-depth analysis of ad performance in your apps.
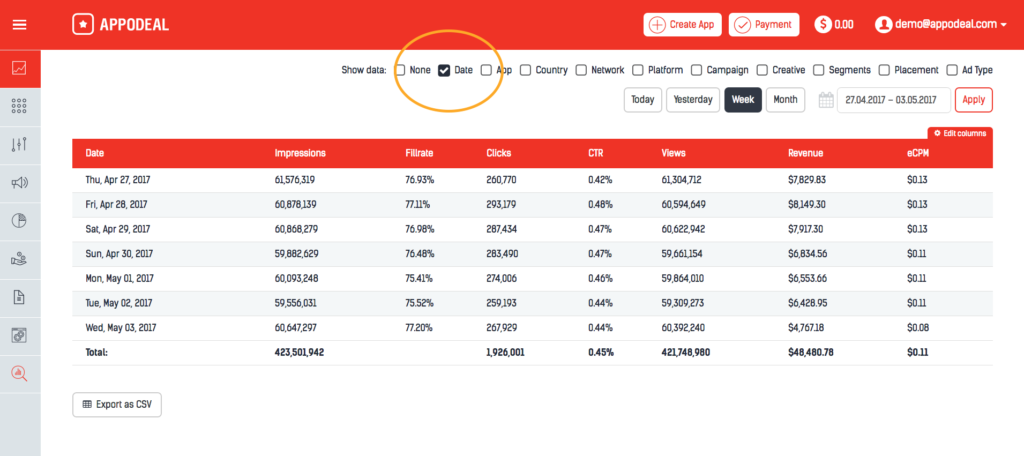
By default, you will see an aggregate of the performance of all your apps worldwide over the last seven days. You can change the data range to any range you want. Fields include impressions, fillrates, clicks, CTR, views, revenue and eCPM.
You can drill down further by selecting various data sets to show.
- App shows you how each of your apps performed for that time period.
- Country breaks down how your apps performed in each country worldwide.
- Network shows how each of the ad networks in our ad mediation stack performed. You can also sort each column.
- Campaign shows the results of your self-served ad campaigns, either from a direct deal advertiser or cross-promo of your own apps.
- Creative breaks down how the different creative ads you've uploaded for your self-served ad campaigns performed.
- Segment shows you the results based on the different user segments you've set up.
- Placement lets you know how the different ad placements you've set up performed.
- Ad Type breaks down how each of the ad formats (Interstitial, video, banner, native, MREC, and rewarded video) performed for your apps.
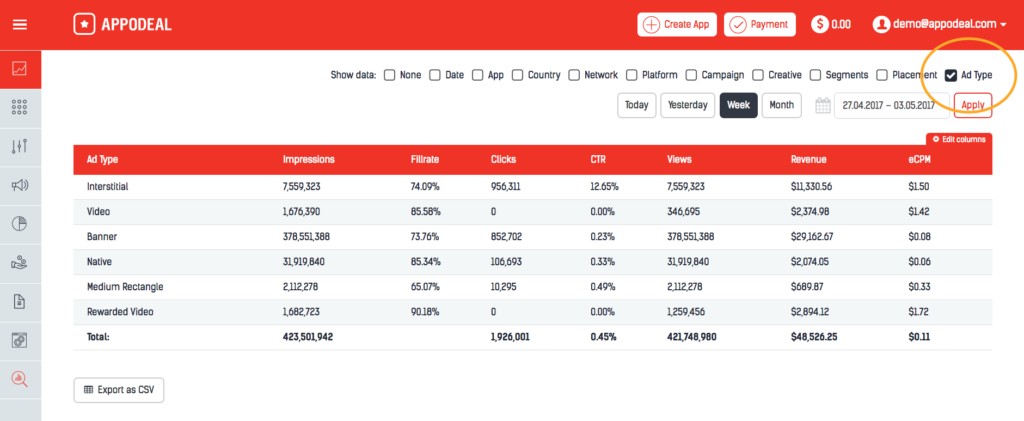
Any of these reports can be exported as a CSV file.
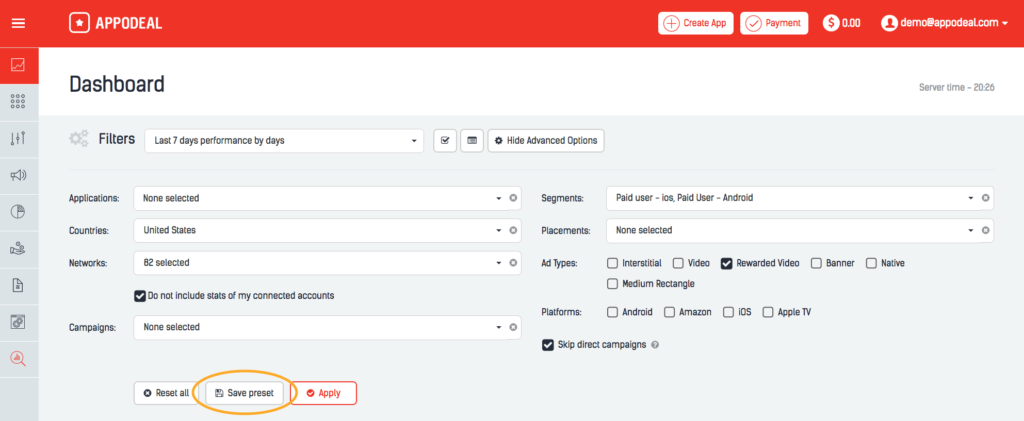
Advanced Filters
You can get even more granular data using advanced filters.
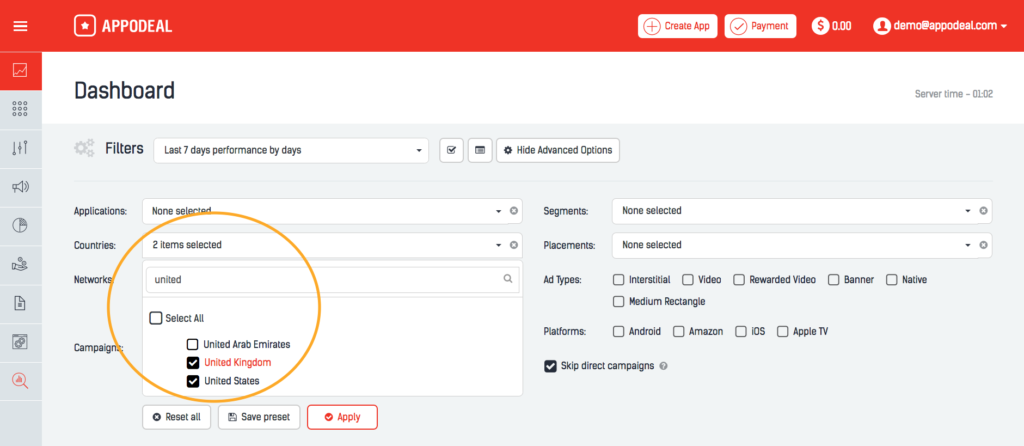
In addition to countries, you can use the advanced filters to filter your data by any combination of: Applications, Ad Networks, Campaigns, Segments, Placements, Ad Types, Platforms.
Save Preset
If there is a set of data you check up on often, the "save preset" function can save you time.